or pick a card to choose
where to begin your adventure

225 players

20-50 min

The Game is Afoot

The Game is Afoot*

“It is of the highest importance, therefore, not to have useless facts elbowing out the useful ones.” — Arthur Conan Doyle, A Study in Scarlet

There’s a fair bit of detective work involved in building a successful digital program. We collect evidence, we investigate clues, we question everything and everyone to get closer to the answers we seek. 

It’s a difficult game, and most fundraisers and marketers face two problems:

  1. Not having enough information to make solid, data-driven strategic decisions.

  2. Having too much data, overwhelming our ability to process and make use of it. 

To help solve the first problem, we’ve compiled as much reliable data as we possibly can on fundraising, advocacy, and marketing metrics across digital platforms. The detailed charts and data points throughout the M+R Benchmarks Study are designed to allow any nonprofit to compare the results they are seeing to what their peers are reporting, and identify which parts of their program may not be cutting the mustard.

To help solve the second problem, we have run extensive analyses to identify key trends, spot weird outliers, and put the findings into context. And we know that strategic decision-making is rarely black and white, so we have also asked our nonprofit participants to share information about their own priorities. 

Those participants have been generous with their time, providing data and thoughtful responses to our questions. We are proud as a peacock to be joined by 225 nonprofit participants this year — more than we’ve ever had at our Benchmarks table. 

These nonprofits do heroic, groundbreaking, world-changing work across a wide range of issue areas. They operate at the local, national, and international level, impacting people and communities around the world. They include environmental nonprofits pushing for a green energy future, relief organizations working with families affected by conflict and disaster, cultural institutions, food banks, public media, animal shelters, and so much more. 

If you are one of those participants, thank you so much for joining us. If you’re not, we hope you’ll consider playing along with us next time around. Either way, we are glad you’re here, and we can’t wait to get started. Let’s roll the dice, follow the clues where they lead, and see what we can discover together.

Guess Who Made Benchmarks

Jonathan Benton Data Analysis
Theresa Bugeaud Data Analysis
Taylor Duncan, Data Analysis
Taylor Duncan Data Analysis
Michelle Hertel, Data Analysis
Michelle Hertel Data Analysis
Lia Mancuso, Data Analysis
Lia Mancuso Data Analysis
Mugo Muna, Data Analysis
Mugo Muna Data Analysis
Sammy Stewart, Data Analysis
Sammy Stewart Data Analysis
Sarah Vanderbilt, Data Analysis
Sarah Vanderbilt Data Analysis
Will Valverde, Writing
Will Valverde Writing
>Laura Klavon, Design
Laura Klavon Design
Lucy Midelfort, Player Management
Lucy Midelfort Player Management
Bobby Burch, Web Development
Bobby Burch Web Development
Tom Giordano, Web Development
Tom Giordano Web Development
Matt Gordon, Web Development
Matt Gordon Web Development
Bobby Goldstein, Project Management
Bobby Goldstein Project Management
Dolly Danger Valverde, Snacks
Dolly Danger Valverde Snacks
Adiyah Ali, Insights
Adiyah Ali Insights
Miranda Carter, Insights
Miranda Carter Insights
Sarah Coughlon, Insights
Sarah Coughlon Insights
, Insights
Alex Hudson Insights
Amanda Jameson, Insights
Amanda Jameson Insights
Nehal Mahmoud, Insights
Nehal Mahmoud Insights
Marium Navid, Insights
Marium Navid Insights
Anne Paschkopić, QA
Anne Paschkopić QA
Eddie Geller, Motion Graphics
Eddie Geller Motion Graphics
Olivia Moore, Graphics
Olivia Moore Graphics
Zoë Soriano, Motion Graphics
Zoë Soriano Motion Graphics
Julia Allenby, Marketing
Julia Allenby Marketing
Linda Zhang, Marketing
Linda Zhang Marketing
Madeline Stanionis, Executive Sponsor
Madeline Stanionis Executive Sponsor

We are M+R, and we are not playing around.

We believe that the nonprofits we work for are essential to advancing the cause of justice, alleviating suffering, and solving the greatest challenges we face.

We bring experience, talent, and unshakeable dedication to our clients through fundraising and supporter engagement, movement building and issue advocacy, and message and brand development.

We have more resources, advice, tools, and other fun stuff waiting for you at www.mrss.com

Find out more about working at M+R and join our crew at www.mrss.com/careers.

HOW TO PLAY

M+R Benchmarks is a fun, fast-paced, data-based game experience everyone can enjoy! There are just a few important features and rules to keep in mind before you begin.

  1. Wherever possible, we have broken out the findings by sector. Each of our participants self-identified the appropriate sector (or, in some cases, fell outside of our defined sectors and selected “Other”). If you are not sure which sector represents your peer group, review the full list of participants to find where you belong.

  2. We also sort our participants by size. For our study, “Small” refers to nonprofits with annual online revenue in 2023 below $500,000; “Medium” is those nonprofits with annual online revenue between $500,000 and $3,000,000; and “Large” covers all those with annual online revenue greater than $3,000,000.

  3. The averages displayed in each chart and discussed throughout Benchmarks represent the median figure for a given metric for all participants who reported data. We do this to avoid having one or two outliers with extraordinary results from having too much influence, as might happen with a mean average.

  4. Not all participants were able to provide data for every metric. If a chart does not include data for a certain sector or size, it’s because we were not able to collect enough results to report a reliable average.

  5. In addition to the median figure, some charts display a range showing the 25th percentile to the 75th percentile. Half of all reported values fell within this range, which can be considered “normal” results for participants in our study.

  6. Do not compare this year’s M+R Benchmarks findings to previous editions! Because our participant pool changes each year, these comparisons will not be simple and straightforward, like Apples to Apples. They will be wrong and upsetting, like Cards Against Humanity.

  7. Wherever we include year-over-year changes, we are including long-term data from this year’s participants. These comparisons are reliable. See the Web Performance section if you want to know more about our feelings when we are prevented from reporting accurate longitudinal data.

  8. If you have any more questions, please reach out to @mrcampaigns or email benchmarks@mrss.com.

And remember the most important rule of all: have fun!


Opening Moves

Key Findings

SCORECARD

  • Average online revenue declined by 1% in 2023.
  • Revenue from monthly giving increased by 6%, and accounted for 31% of all online revenue.
  • Nonprofits raised an average of $0.94 through direct mail for every dollar raised online. Direct mail revenue fell by 6% in 2023.
  • Total advertising investment by nonprofits increased by 13%. The biggest change was in radio spending, which increased by 67%.
  • Yes, radio! We are super excited to get to share ad spending data beyond our usual detailed exploration of digital channels. See the full ads section for more (including our usual detailed exploration of digital channels).
  • About half of M+R Benchmarks participants reported working with social media influencers in 2023. Of those, 17% relied only on paid partnerships, and 30% used a mix of paid and unpaid influencer work.
  • TikTok audiences for nonprofits increased by 112% in 2023, far faster than other social media platforms. Facebook and Instagram follower counts grew by 6% and 11%. The number of Twitter/X followers declined by 1% on average.
  • Email revenue declined by 7% on average. The share of all online revenue directly sourced to email was 16% in 2023.
  • The majority of nonprofit website traffic came from users on mobile devices — 52%, with 48% of traffic from users on desktop devices. However, 78% of revenue came from users on desktop devices.

There is analysis — surveying the board, seeing where all the pieces fit, calculating percentages.

There is experience — familiar patterns to use as a guide and recurring pitfalls to avoid.

There is strategy — foresight, contingency planning, the rare and precious ability to look several steps ahead and discern complex branching paths.

And then there is something more. Intuition, creativity, an instinct for timing and an appetite for risk. A sudden flash of insight. A bold gambit that changes the game.

All of these play a role in how nonprofit digital programs advance and evolve. Let’s take a look at some of the topline data and trends that can help you make the right moves. 

Overall online revenue was relatively flat — on average, online revenue was 1% lower than in the previous year. Some nonprofits saw increased revenue; average online revenue was 3% higher for Public Media nonprofits, and 4% higher for the Health sector. At the other extreme, Disaster/International Aid nonprofits saw online revenue decline by 7% on average.

We have a lot more to say about all this in the Fundraising section, but the short version is that these results may say less about what happened in 2023 than they do about the different context faced by nonprofits heading into the year.

Those Disaster/International Aid nonprofits, which experienced the largest drop in revenue in 2023? That result followed a 10% increase in revenue in 2022, largely connected to the escalation of conflict in Ukraine.

Looking back further, there has been little year-over-year change in online revenue over the past three years: single digits, up and down. This plateau followed a king-sized spike in revenue in 2020, the first year of the pandemic. Since then, the experience of many nonprofits has been about finding adjustments to a new normal.

Another way to put the change in online revenue into perspective is to compare to direct mail results. In 2023, while online revenue declined by 1% on average, direct mail revenue declined by 6%. 

On average, nonprofits raised slightly more revenue through online channels than through direct mail. For every $1.00 in online revenue, nonprofits raised $0.94 via direct mail.

Digital tools aren’t only a key driver of revenue; they are critical to identifying, recruiting, organizing, and mobilizing supporters. In addition to our findings on broadcast mobile messaging (which can be found here), we asked M+R Benchmarks participants to share details on how they are using peer-to-peer (P2P) texting for mobilization.

Only a subset of nonprofits take advantage of P2P text messaging: 23% of M+R Benchmarks participants had an active P2P program in 2023, comparable to the 21% that conducted phone banks for advocacy or community organizing.

Several of the most common uses of P2P texting centered on mobilizing audiences to participate in real-world actions. Of nonprofits with P2P programs, 85% used them to promote event attendance, 75% recruited volunteers, and 68% leveraged P2P texting to support GOTV efforts.

The one-to-one nature of P2P texting also creates a unique opportunity to begin and continue a deeper conversation with supporters, and then expand an organizer’s reach. A majority (58%) of nonprofits with P2P programs used these contacts for relational organizing — asking supporters to activate people in their own network.

Nonprofits relied on a range of senders in their P2P messaging programs. Paid employees sent P2P messages for 82% of the nonprofits with active programs. Unpaid volunteers texted on behalf of 52% of these nonprofits, and 43% used paid contractors.

Every nonprofit with a P2P text program sent messages to their own opt-in subscriber list. For many, this list is relatively modest in size — nonprofits had an average of 158 mobile subscribers for every 1,000 email list subscribers. To supplement this audience, 47% of nonprofits with P2P programs also targeted outside audiences beyond their existing opt-in file — typically lists culled from sources like voter databases, or rented from political campaigns or other organizations. 

Throughout M+R Benchmarks, we generally stick to aggregates and collectives. We talk about nonprofits as a whole, about participants, about programs, about sectors. We refer to ourselves with a royal we.

But the heart and soul of every one of these abstractions is made up of real, living, breathing, individual humans. We wanted to learn more about who those people are, and assess the progress that nonprofits have made in building diverse teams.

We asked M+R Benchmarks participants to share the data they submitted to the Equal Employment Opportunity Commission (EEOC). It’s difficult to report specifically about fundraising, advocacy, and marketing staff, so our findings include organization-wide staff.

Before we take a look, there are a few limitations to this data set that should be acknowledged. The EEOC asks employers to identify the percentages of staff that fall into a handful of racial categories. These include:

  • American Indian or Alaska Native

  • Asian

  • Black or African American

  • Hispanic or Latino

  • Native Hawaiian or Other Pacific Islander

  • White

  • Two or more races

This list has serious flaws, including the treatment of “Hispanic or Latino” as a racial category and the conflation or exclusion of other racial identities. As one M+R Benchmarks participant pointed out, the standard EEOC forms erase Arab identities, making communities that have been heavily politicized and otherized invisible.

Because of these limitations, we have chosen to group racial categories other than White under the umbrella of Black, Indigenous, and People of Color (BIPOC). We also want to acknowledge that other important identities, including disability and gender, are not managed well by EEOC, and are not included in our analysis here.

The upside of the EEOC data set is that it is collected consistently among U.S. employers, which allows us to get a clear picture within the constraints of this data set.

Here’s what we found: the portion of nonprofit staff who identify as BIPOC rose from 25% in 2022 to 27% in 2023.

EEOC chart

That’s for staff across levels and departments, from the executive director at a national organization to the warehouse workers at a community food bank to the people who are reading this report.

At the executive and senior management level, BIPOC representation rose from 19% to 21%. BIPOC staff made up 27% of first- and mid-level management, a slight decline from the 28% in 2022. The biggest increase came from the wide range of job categories that fall outside of management, with BIPOC employees making up 29% of all staff in 2022, and 35% in 2023.

Many nonprofits have made a vocal commitment to diversity, equity, and inclusion, and to hiring, retaining, and promoting more people of color. This EEOC data is just one measure of racial diversity, and can’t capture the full extent of progress toward equity and inclusion or the experiences of BIPOC staff. This kind of change takes time — there are only so many new hires or jobs turning over in any given year. The reporting in 2023 makes it clear that there is more work to be done, especially at more senior (and higher-paying) levels. 

We’ve collected more data from more nonprofits for M+R Benchmarks this year than ever before. In addition to the peer-to-peer mobilization and EEOC data above, we are thrilled to provide ad spending data beyond digital channels, a deeper look at nonprofit partnerships with social media influencers, and more.

Thanks again to our nonprofit partners, and to you for reading. Go ahead. It’s your move.

Fundraising

Fundraising

SCORECARD

  • Online revenue for the average nonprofit decreased by 1% in 2023.
  • Revenue from one-time giving fell by 5%, while revenue from monthly giving rose by 6%.
  • Monthly giving accounted for 31% of all online revenue in 2023, up from 27% the previous year.
  • Nonprofits raised an average of $0.94 through direct mail for every dollar raised online. Direct mail revenue fell by 6% in 2023.
  • December giving made up 26% of all online revenue, and 34% of one-time online revenue. Donations made on December 31 accounted for 5% of 2023 revenue.

There are moments when unpredictable, uncontrollable, and largely unrepeatable events drive an influx of revenue. A natural disaster might spur an outpouring of generosity, or the political conversation draws focus to your cause. Perhaps some Rich Uncle Pennybags hands over an unsolicited and jaw-dropping donation. Maybe there’s a bank error in your favor (collect $200), or you win second prize in a beauty contest (collect $10).

We try to make the most of these opportunities when they arise, but this is all shaky ground on which to build a fundraising program.

We can only go so far relying on chance and happenstance. Instead, long-term growth comes from making investments that will deliver results over time: email and mobile list acquisition, ads that are aggressively tested and optimized, a social media program that supplements organic reach with paid influencers, deeper audience research to understand what inspires, thoughtful message testing to find the strongest case for giving, an emphasis on monthly giving and lifetime giving. These are the stable foundations for successful programs that can continue to support an organization’s goals no matter what.

Total online revenue for nonprofits in our study declined by 1% in 2023. So, pretty much flat. And we found a very similar trend when looking at small nonprofits raising less than $500,000 in annual online revenue, medium nonprofits in the $500k to $3MM range, and large nonprofits with annual online revenue over $3MM.

Which might make it seem at a glance like things generally held fairly steady last year. But while some sectors reported a similar average year-over-year change, Disaster/International Aid nonprofits saw a 7% drop. At the high end, Health nonprofits saw 4% higher revenue on average.

Even those median figures may be obscuring more than they reveal. If we expand our view to include the range from the 25th percentile to 75th percentile, we see a much more complete picture. And what a picture it is!

This middle range indicates that a relatively small increase in revenue — in the single digits — was almost as likely as a modest decline. That’s for the total pool of M+R Benchmarks participants. The range among Cultural nonprofits was wider. While many did see a decline in online revenue, those at the 75th percentile saw 42% higher revenue in 2023!

And then there is the Disaster/International Aid sector. Here, nonprofits in the 25th percentile reported 39% less online revenue than in the previous year. Large swings in revenue from year to year are not unusual for this issue space, with high-profile humanitarian crises driving periods of exceptional generosity.

The invasion of Ukraine in 2022 led to a surge of giving to organizations involved in crisis response or supporting displaced people. Indeed, if we look at the change in revenue from 2021 to 2022, the Disaster/International Aid sector saw the fastest growth. The decline in revenue in 2023 can be seen as a reversion to pre-Ukraine-crisis levels of support for nonprofits in this space.

Taking a longer view can help put the year-to-year changes and volatility into context. Many nonprofits, especially those in the Hunger/Poverty space, experienced an unprecedented surge in giving during the first year of the Covid pandemic. The year-to-year changes in the years since have been more modest.

Online Revenue Year Over Year

So far, we have looked only at online revenue. And by “so far,” we mean “so far in this section” as well as “so far in the 18 years since we started publishing the M+R Benchmarks Study.” 

For the first time this year, we are able to include data on direct mail giving. In 2023, nonprofits saw direct mail revenue decline by an average of 6% from the previous year. This was a sharper drop than the 1% reported for online revenue, though once again the Disaster/International Aid sector was an outlier. While this sector saw the biggest reduction in average online revenue, direct mail revenue increased by 4%.

For groups in our study, online giving made up a slightly larger portion of total revenue than direct mail giving — for every dollar raised online, nonprofits raised $0.94 through direct mail.

On average, small nonprofits (those with annual online revenue under $500k) received more revenue from direct mail than from onlne sources.

For medium ($500k–$3MM in annual online revenue) and large (annual online revenue over $3MM) nonprofits, more revenue was sourced to online channels than direct mail.

With online programs an increasingly important source of revenue, every donor matters — especially those who provide reliable support over time. Let’s turn back again to look only at online giving, and explore a few of the ways that donors choose to make multiple gifts.

First, monthly giving accounted for 31% of all online revenue in 2023, up from 27% in 2022. While revenue from monthly giving increased by 6%, one-time revenue declined by 5%. That split — increased monthly revenue, decreased one-time revenue — was widespread. Every sector and size breakout we measured showed an average increase in monthly revenue. Only three sectors reported a rise in one-time revenue — Cultural, Health, and Public Media.

The average size of a monthly gift was $24, while the average one-time gift was $115. Hunger/Poverty nonprofits had the highest average gift size for both types of giving: $45 for monthly giving, $174 for one-time gifts. Breaking out results by size, small nonprofits had higher average monthly and one-time gifts than medium or large nonprofits.

While the overall average gift size is instructive, successful programs don’t treat their entire supporter base as a monolith with a single centerpoint. Instead, audiences are segmented by engagement, demographics, geography… and giving history.

In 2023, donors giving at least $500 made up just 6% of all small-dollar donors (defined here as those who only gave under $1,000 in a year). Their donations made up 23% of total revenue. About half (57%) of small-dollar donors fell into the $50–249 giving level; their giving represented 47% of one-time gifts revenue.

Larger gifts mean a bigger impact on overall budget — that’s no surprise. What might be more surprising is how consistent these results have been in recent years. In 2021, 2022, and 2023, donors giving $50–99 made up 23%, 23%, and 23% of one-time donors, and gave 12%, 11%, and 11% of revenue.

Even as major, world-shaking events affect the work that nonprofits do and the issues that the public prioritizes, these ratios stayed essentially unchanged. Even as metrics like overall revenue, ads ROAS, and email response rates shifted up and down, these ratios held steady. The consistency is remarkable.

Of course, someone who makes a one-time gift isn’t necessarily someone who will only give one time. Donors who made only one-time gifts online gave an average of 1.2 times in 2023. To be clear, this is not a measure of lifetime value, or retention for donors who gave in previous years (we’ll get to that in a sec). These 1.2 gifts per donor represent repeated giving within 2023, and meant that the average donor who made only one-time gifts gave $165 over the course of the year.

Monthly donors also sometimes make additional gifts over and above their recurring donation — whether inspired by breaking news or solicited as part of a campaign. Monthly donors made an average of 0.2 one-time gifts in addition to their monthly gift, with average one-time giving of $18.

The long-term value of a donor isn’t only determined by how much they give in a single gift, or in a single year. Donors who make a commitment to supporting a nonprofit year after year are essential to long-term stability and growth.

One-year retention for 2023 was 44%, which means that out of all one-time donors in 2022, almost half made another one-time gift in 2023.

If we consider only new donors — those who made their first online gift in 2022 — the retention rate was just 23%. Of those supporters with a previous giving history who gave in 2022, 61% gave again in 2023. While the specific rate varied from sector to sector, the pattern remained consistent, with first-time donors substantially less likely to be retained.

We’ve taken a look at how donors are giving, and how much, and how often — next, we turn to when.

Overall, 34% of online revenue from one-time gifts came in during December, 2023. November was the next-highest month, at 15%, with revenue in every other month ranging between 3% and 5% of the overall total.

Among other things, November included Giving Tuesday in 2023, which may have helped increase that month’s share of the annual total. In 2024, Giving Tuesday will fall in December, which has the potential to make December even more important to reaching budget goals. 

Including both one-time and monthly donations, December giving accounted for 26% of all online revenue. The last week of December alone accounted for 13% of the year’s total online revenue. And December 31, the last-chance, match-deadline, clock-is-ticking, nail-biting final day of the year: 5% of 2023 revenue.

Online revenue was 7% lower on December 31, 2023, than it was on December 31, 2022. For email, revenue on the final day of the year declined by 10%.

Pulling back to look at the final week of December, overall revenue was 2% lower than in the previous year. Despite a drop on 12/31, email revenue held steady in the final week of 2023 compared to 2022. Because December 31 fell on a weekend, many nonprofits shifted messaging slightly earlier in the calendar, which may have had an impact here.

Overall, December revenue was 4% lower overall in 2023, while email revenue declined by 2%. The largest decrease in December revenue came in the Cultural sector, which reported 15% lower email revenue, and 12% lower revenue overall. The only sector to see an increase in December giving was Wildlife/Animal Welfare, with 3% growth overall.

So many factors are outside our control as fundraisers — from global conflict to the day of the week that the year happens to end on. Swings in revenue will happen, sometimes quite dramatically.

This is all the more reason to emphasize stable and reliable sources of revenue, from monthly donors to annual giving days to retaining and reactivating previous donors. And if you happen to pass go, don’t forget to collect your $200.

Email Messaging

Email Messaging

SCORECARD

  • Email list sizes increased by 7% in 2023, after 5% and 8% growth in the previous two years.
  • Email revenue declined by 7% on average, while the share of all online revenue directly sourced to email was 16%.
  • For every 1,000 fundraising messages sent, nonprofits raised $76. This marks a 20% decrease from 2022.
  • Nonprofits sent an average of 59 email messages per subscriber in 2023. There was a 12% increase in volume from the previous year.
  • The average response rate for advocacy email was 1.4%, a 10% decline from the previous year.
  • The average response rate for fundraising email was 0.07%, a 16% decrease compared to 2022.

We don’t like to complain, but listen: email fundraising is hard. Growing your list is hard. Building a thriving messaging program is hard — and the data suggests it is not getting any easier. (It’s fun, though, too. We can’t deny that either.)

It takes diligent planning, consistent effort, and constant creativity to build a program. Increasing the audience subscriber by subscriber, finding what works message by message, climbing that ladder rung by rung. It takes so much less — a change in corporate or government privacy regulations, a tweak to the Gmail inbox, a shift in audience priorities — to slide right back down again.

First, the ascent: over the course of 2023, nonprofits added an average of 0.27 new email subscribers for every subscriber they had at the start of the year. That means that a nonprofit that had a list size of exactly 100,000 subscribers on January 1, 2023 would add 27,000 new subscribers by December 31.

Those numbers (and most of what we report in M+R Benchmarks) represent the median figure. If we broaden our view, we see that some nonprofits greatly exceeded that pace.

The colored bars on the chart represent the range from the 25th percentile to the 75th percentile. At that higher end of the “normal” range, nonprofits added 0.55 new joins per start-of-year subscriber. Our hypothetical nonprofit with 100,000 subscribers would add 55,000 new email listmembers over the course of 2023.

Now, the descent: 15.7% of email subscribers were lost to churn over the course of 2023. That churn was divided between bounces (6.7%) and unsubscribes (8.7%). For Environmental nonprofits, average churn was 20.7%, and in the Rights sector average churn was 25.4%! That’s a long way to slide down!

We move forward, we fall back. We add new subscribers through advocacy actions, acquisition ads, email signup forms, and more. We lose audience through bounces and the unsubscribe button that Gmail very helpfully adds to our messages. It’s the balance of those two opposing forces (plus complicating factors like removing inactive addresses) that determines the change in overall list size.

In 2023, email list sizes increased by 7% on average, after growth of 5% and 8% in the previous two years. Health nonprofits reported steady gains over that three year period, with 14% increases in each year. While there was more volatility in other issue areas, the median nonprofit in every sector reported email audience growth in 2023.

On average, nonprofits sent 59 messages to each subscriber over the course of 2023, with 27 of those messages devoted to fundraising. Both the overall volume and the content of those messages varied widely between nonprofits in different sectors.

Health nonprofits sent the fewest messages — 28 overall, with about half of those fundraising messages. Subscribers to Wildlife/Animal Welfare nonprofit email programs could expect to receive a whopping 86 messages. That’s a lot! But it’s worth noting that there was a broad mix of advocacy, engagement, and other messages in this mix and that the volume of fundraising appeals was close to the overall average (31 for the Wildlife/Animal Welfare sector; 27 overall). Public Media nonprofits also sent a relatively high volume of messages — but of their 79 email messages per subscriber, 55 were newsletters.

Average email volume increased by 12% from the previous year, with fundraising messaging increasing at the fastest rate.

For most nonprofits, email volume ebbs and flows throughout the year. Given the importance of end-of-year fundraising (including Giving Tuesday), it should be no surprise that the highest overall volume came in November and December, each with over 7 messages per month on average.

Some nonprofits will have their own local peaks, typically driven by a combination of external events and the organization’s own strategic choices. Disaster/International Aid email volume spiked in February, when many nonprofits marked the anniversary of the escalation of conflict in Ukraine. For Public Media nonprofits, annual pledge drives likely contributed to especially frequent messaging in May.

We’ve looked at the size of email audiences. We’ve looked at how many messages, and what types, nonprofits sent. That baseline audience size, and those messaging choices, are important. But the success of an email program rises and falls with supporters: how do they respond to all this messaging?

For fundraising email messaging, the average click-through rate (the percentage of email recipients who clicked on a link in the message) was 0.54%. Of those who clicked through to the donation page, 15% completed a gift. The average response rate for fundraising email (the percentage of email recipients who completed a gift) was 0.07%.

For advocacy email, the corresponding metrics tended to be much higher. The average click-through rate was four times higher at 2.1%, the page completion rate was 72%, and the average response rate was 1.4%.

The average email fundraising response rate dropped by 16%, and this downward slide was even steeper for some nonprofits. In the Hunger/Poverty and Rights sectors, average fundraising email response rate dropped by 28%. For Environmental nonprofits, the decline was a more modest 6%.

It wasn’t just fundraising response rates. Just about every key email metric was lower in 2023 than it was in 2022. As nonprofits sent more messages to larger audiences, the likelihood of any individual email generating a click, action, or donation declined.

One way to see the impact of declining email metrics is by looking at email revenue per 1,000 fundraising emails sent. In 2023, nonprofits received an average of $76 in revenue for every 1,000 fundraising appeals — which is to say, a single fundraising email landing in a single inbox was worth about seven and a half cents.

This figure is substantially lower than what nonprofits saw in 2022. The average change in revenue per 1,000 fundraising emails was a 20% decline, with some sectors seeing even more dramatic drops. The exception was Disaster/International Aid nonprofits, which reported a 2% increase.

This decline outpaced the increases in audience size and fundraising email volume. Overall email revenue was 7% lower in 2023 than the year before. However, Hunger/Poverty nonprofits saw a 3% increase in average email revenue, and Public Media nonprofits reported a 17% increase. Small nonprofits (those with annual online revenue under $500,000) saw email revenue shoot up by 34% in 2023.

Remember when we said this was hard? It took an average of 1,429 fundraising emails to generate 1 gift! Send 1,000 appeals, get $76 back!

But nonprofits keep climbing that ladder, because it makes an impact. All those messages landing in all those inboxes matter — in 2023, 16% of all online revenue was directly sourced to email — a metric that includes only gifts that came from users clicking on email donation links.

Moving onward and upward is rarely easy and never uncomplicated. Setbacks are inevitable, and some factors are outside our control. And yet, nonprofits keep climbing, and email programs continue to be a key part of online success.

Mobile Messaging

Mobile Messaging

SCORECARD

  • Mobile messaging (a.k.a. text messaging or SMS/MMS) subscriber list size increased by 5%.
  • Nonprofits had 158 mobile subscribers for every 1,000 email subscribers. The Rights sector was an outlier with an average of 485 mobile subscribers per 1,000 email subscribers.
  • Mobile message volume increased by 40% in 2023, and we found wide differences in volume among participants.
  • Fundraising mobile messages generated $92 in revenue for every 1,000 messages sent.
  • Revenue from mobile messages increased by 14% from the previous year, and accounted for 0.37% of all online revenue in 2023.

When every character is counted, every character counts.

Sure, it takes creativity and skill to craft a compelling action alert or fundraising appeal in email (see the Email section for our complaints about how hard it is). But when you’re trapped in a 160-character straitjacket, when your audience is smaller than in other channels, when their tolerance for mass alerts is possibly strained by increasing volume… making the most of every mobile message matters.

Let’s start with those audiences. For most nonprofits, mobile audiences were significantly smaller than other channels. On average, nonprofits had 158 mobile subscribers for every 1,000 email subscribers. The sector with the highest mobile-to-email subscriber ratio was Rights — the average nonprofit had 485 mobile subscribers for every 1,000 email subscribers, meaning the mobile list was not quite half the size of the email list.

It’s important to note that these are not truly separate audiences. In many cases, mobile lists have grown hand-in-hand with email lists, the same sign-up form enrolling a new subscriber to both channels. Some subscribers receive only email; some receive only mobile messages; many will receive both.

Mobile audiences increased by 5% in 2023, a lower rate of growth than see in previous years. In 2022, mobile lists grew by 7% on average, following a 16% increase in 2021. All of these figures represent net growth, accounting for both new subscribers and those removed from the list.

As audiences grew in 2023, so did mobile message volume. On average, nonprofits sent 40% more mobile messages in 2023 than in 2022 — and both advocacy and fundraising message volume increased by more than 50%.

This increase doesn’t necessarily mean that nonprofits were overloading our cell phones with asks and appeals. The median number of mobile fundraising appeals sent per subscriber over the course of the year was 7.7, along with 4 advocacy messages.

Mobile message volume was highest in December — as with email, this spike was most likely connected to end-of-year fundraising efforts. Wildlife/Animal Welfare nonprofits kept up a steady stream of messaging throughout the year — for this sector, volume peaked at 5.3 messages in August, with June the quietest month at 2.9 messages per subscriber.

As nonprofits continue to explore tactics and seek to increase the value of their mobile files, messaging volume can range significantly. Those at the 25th percentile for fundraising message volume sent just 2.1 mobile appeals in 2023. At the 75th percentile, nonprofits sent 15.5. Similar ranges were reported for advocacy messaging.

Of course, the number of fundraising messages sent — whether it’s 2.1 or 7.7 or 15.5 — matters a lot less than the response. For every 1,000 fundraising messages sent, nonprofits generated $92 in revenue. This compares favorably to the $76 per 1,000 fundraising messages reported for email, but still marks a 25% decline from the previous year.

For many of our charts, the overall average provides a reasonable approximation of what most nonprofits might expect. This… is not one of those.

The median Rights nonprofits received $15 per 1,000 mobile fundraising messages sent. Environmental nonprofits also saw a relatively low average of $29. For Health nonprofits, the return was an order of magnitude higher — $308 in revenue for every 1,000 fundraising messages sent. And for the Hunger/Poverty sector, the average return per 1,000 messages was $769!

Some of the variability here may be due to our relatively small sample size: not every Benchmarks participant reported mobile messaging fundraising data. (In fact, not every Benchmarks participant sends mobile fundraising messages.) But we have also seen a wide range of volume, and there are profound differences in message content and tactics.

In 2022, just 0.37% of online revenue was sourced to mobile messaging. After a 14% increase in mobile revenue last year, the share of online revenue from mobile messaging rose to 0.37%.

Compared to organic web traffic, digital advertising, email, or other channels, mobile messaging continues to make a relatively small impact on overall revenue. There remains enormous untapped potential for many nonprofits. Continuing to expand audiences, executing thoughtful strategy, and making every message matter are the keys to growth.

Advertising

Advertising

SCORECARD

  • Nonprofit digital ads spend increased by 13% in 2023, with nonprofits reinvesting $0.12 in digital ads for every dollar of online revenue.
  • Across digital and non-digital advertising channels, 61% of spending was dedicated to direct fundraising.
  • Among digital channels, search and social media made up the largest share of fundraising advertising budgets. Linear television made up 77% of non-digital fundraising advertising spending.
  • Spending on connected TV for fundraising advertising increased by 50% in 2023, aligned with a 46% increase in digital audio budgets.
  • Search advertising had the highest return on ad spend (ROAS) at $2.70.

Just about anyone can cover one single spot. Maybe you start with a Google Grant, helping drive traffic to your site. Simple. Manageable.

Then you stretch a little further, supplementing with paid search. You spot an opportunity to reach new audiences on Instagram, and soon enough you are straining to include several social media platforms.

Before you know it, you are knee-deep in display ads, you’ve got your hands on pre-roll video, you’ve elbowed your way into an experiment with digital audio, and you’re pretzeling audaciously to cover connected TV, bending over backward to find and engage the audiences that matter to your cause.

Above all else, it takes flexibility to manage the array of channels, platforms, creative, audiences, budgets, and response metrics that make up a modern ads program. In order to try to capture more of this complexity, we are including advertising investment data from non-digital channels for the first time in M+R Benchmarks this year. We’ll put a spotlight on digital ad performance a little later, but first let’s look at how nonprofits approached advertising overall.

Including both digital and non-digital channels, 61% of advertising spending by nonprofits was dedicated to direct fundraising efforts. Awareness advertising accounted for 25% of spending, and nonprofits spent 10% of advertising dollars on lead generation.

The balance between these three was markedly different for nonprofits of different sizes. Small nonprofits spent 89% of budgets on direct fundraising, and only 3% on awareness advertising. For large nonprofits, the split was 58% direct fundraising, 27% awareness. With larger budgets comes greater flexibility to invest in branding, education, and expanded reach.

Next, let’s look at spending by channel for each of these three major advertising goals. Among digital channels, search and social media spending combined made up 80% of fundraising advertising budgets.

Large nonprofits tended to spread spending more widely into other channels. Search and social accounted for 90% of spending by small nonprofits, 80% for medium nonprofits, and 78% for large nonprofits. Larger advertising budgets create more opportunity to experiment and optimize within new channels.

Among non-digital channels, linear television consumed the majority of fundraising advertising budgets — 77% overall. Small nonprofits devoted 42% of non-digital fundraising advertising budgets to print, compared to just 20% for medium nonprofits and 17% for large nonprofits.

The balance between channels looks quite different for advocacy advertising, where the immediate goal is to drive signatures or some other action rather than donations. Among digital channels, social advertising made up half of advocacy spending — 50% overall, and 100% of spending by small nonprofits.

Compared to fundraising advertising, non-digital spending investments were not as heavily skewed toward linear television. Large nonprofits spent 16% of non-digital advertising budgets on print, and 15% on out of home advertising — billboards, bus shelter ads, etc. Medium nonprofits split this spending between linear television (63%) and print (37%). Small nonprofits did not report meaningful spending on non-digital advocacy campaigns.

For awareness advertising, nonprofits of all sizes shifted spending toward digital video (18% on average overall), out of home, and radio advertising. When nonprofits were looking to raise visibility to wider audiences rather than drive direct response, these channels were more important.

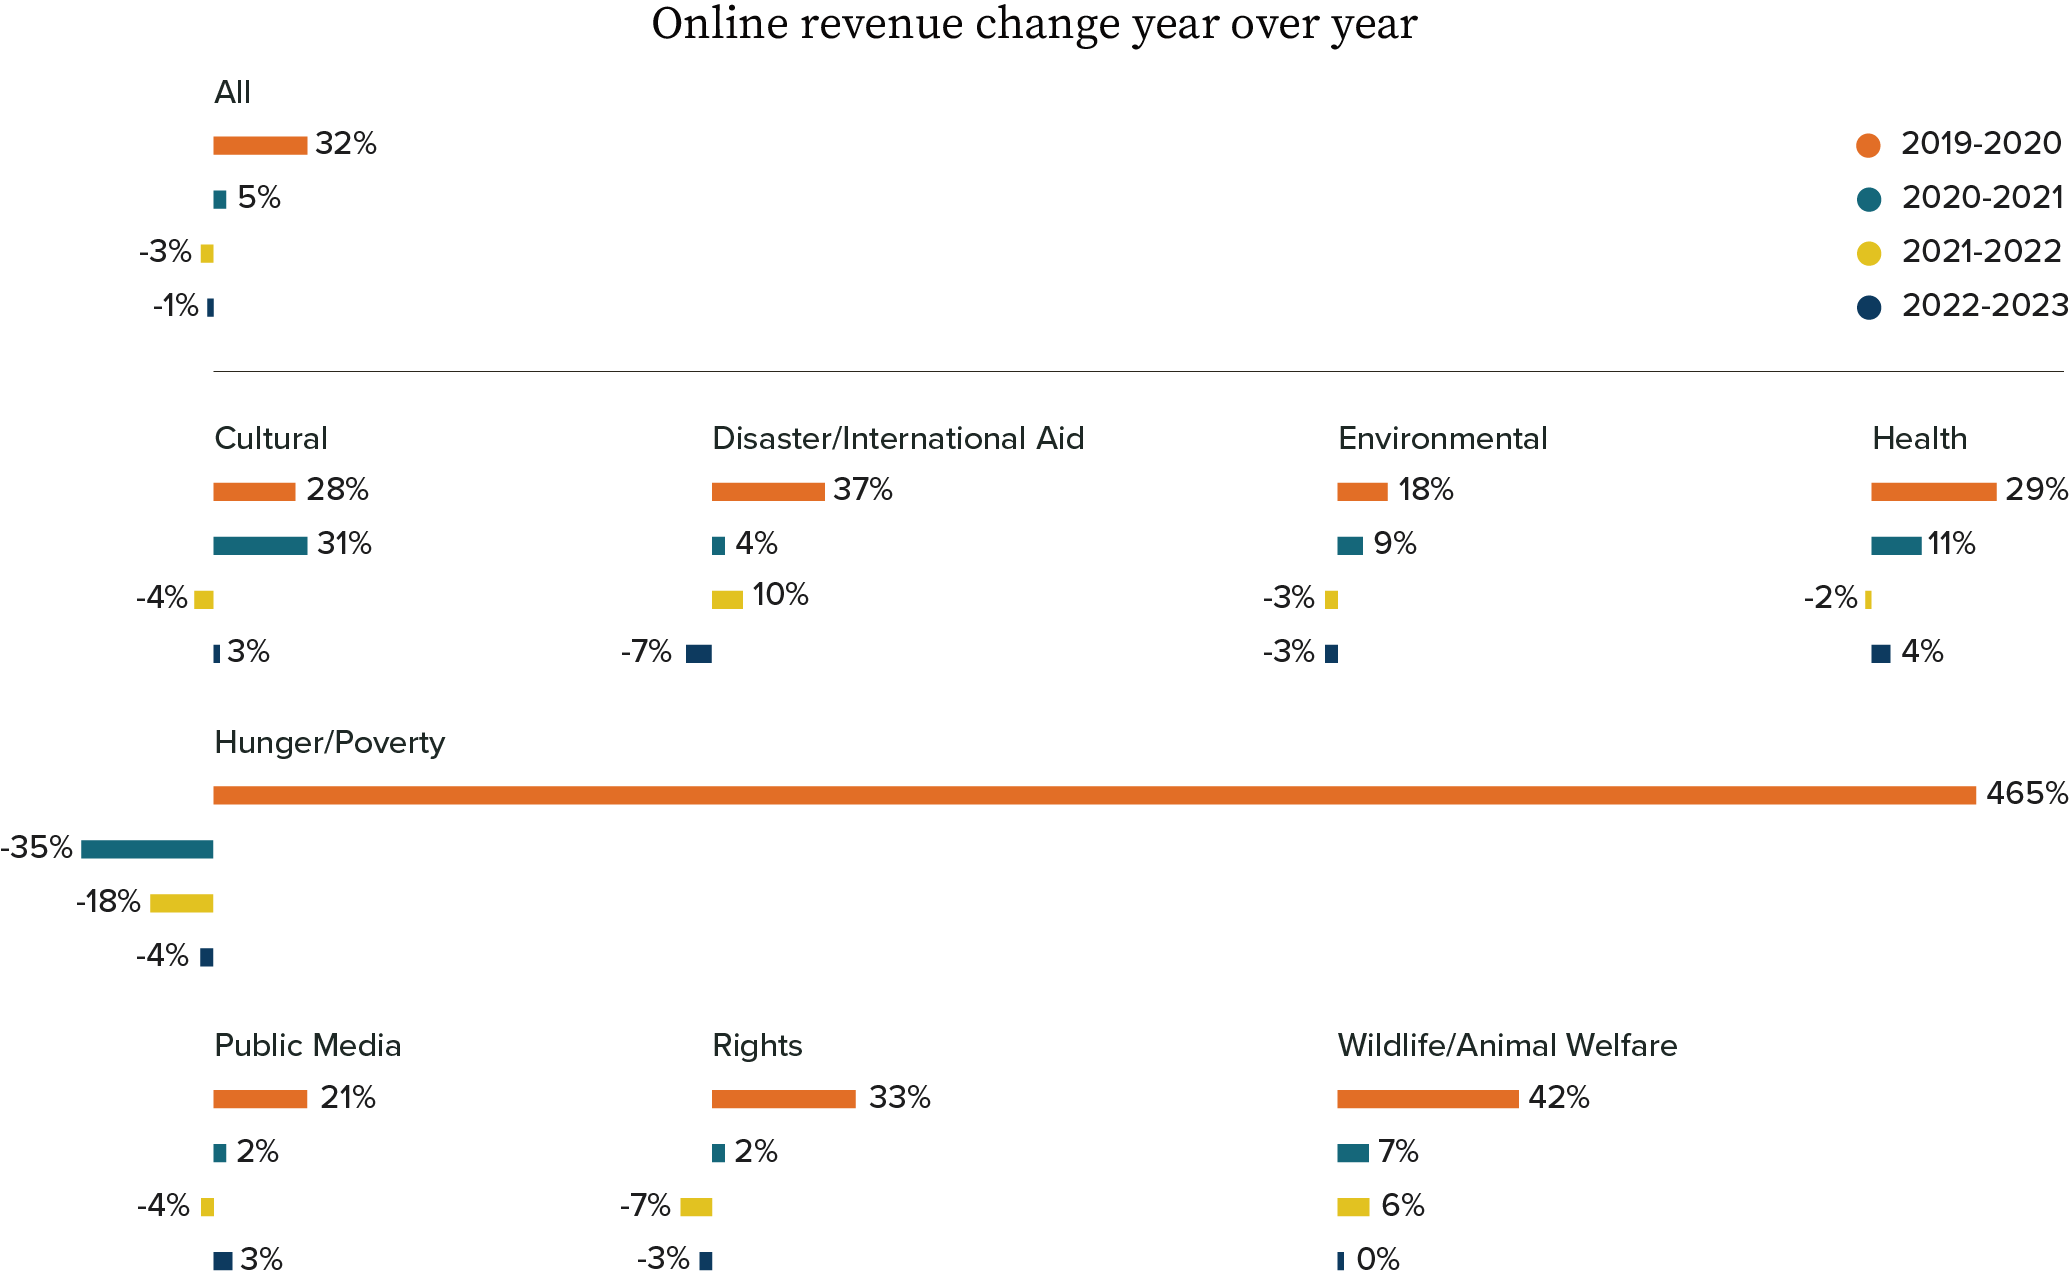
Total investment in advertising increased by an average of 13% in 2023, with some sectors reporting a significant increase in ad spending (Environmental: up 35%; Health: up 33%) and others scaling back (Public Media: down 17%; Rights: down 9%).

Small nonprofits increased ad spending by 27%, medium nonprofits by 22%, and large nonprofits by 11%.

Nonprofits increased fundraising ad spending across nearly every channel. The biggest spike in spending was in radio advertising (as we’ve seen, radio made up only a small share of overall budgets, so this is a large percentage change but not necessarily a big shift in absolute dollar amount). Connected TV increased the most among digital channels, with 50% larger budgets on average. The only fundraising channel where nonprofits pulled back on spending compared to 2022 was Meta.

Now let’s turn our attention specifically to digital channels. To put these year-over-year changes in perspective, nonprofits reinvested $0.12 in digital advertising for every dollar raised online. As with the change in spending levels, we see large differences by sector.

In the Health sector, a nonprofit with $100,000 in online revenue would spend $23,000 on digital advertising over the course of the year. A Rights nonprofit with $100,000 in online revenue would invest just $3,000.

We’ve examined ways nonprofits stretch, balance, and redirect advertising budgets. Now we can take a look at how audiences responded, starting with return on ad spend (ROAS) for fundraising advertising.

As we mentioned earlier, and as we mention in every year’s M+R Benchmarks, search advertising has the highest ROAS of any channel. For every $1.00 nonprofits spent on search advertising for fundraising, they raised $2.70 in revenue.

Occasionally as we are analyzing M+R Benchmarks data, we see results that knock us off balance. While we don’t make direct comparisons from one edition of M+R Benchmarks to the next, we take notice when a data point is far out of step with what we typically see. Return on ad spend for display advertising was one of those this year — the $1.26 raised per dollar spent is much higher than what we have reported in previous years.

We give these metrics extra scrutiny beyond our typical QA to make sure we haven’t made an error in our calculations. If the numbers hold up, we look for possible explanations, even if it means getting tangled up in knots. The display ROAS numbers held up.

So what’s going on? We can speculate.

As we get closer to Google Chrome deprecating support for third-party cookies, nonprofits have adopted more sophisticated cookieless measurement tools. This in turn may enable them to better track viewthrough conversions from Safari and Firefox, allowing more revenue to be correctly attributed to display advertising.

Another (possibly smaller) factor: Google has strongly encouraged advertisers to use campaign formats that combine multiple channels. For example, Performance Max campaigns set audience and performance goals, with Google serving a mix of Google Display Network, YouTube, and search advertising. Because these campaigns include search placements, they often have a high ROAS, which can be difficult to distinguish from display-only campaigns.

Among non-digital channels, the highest ROAS was $0.56 for radio. Out of home had the lowest ROAS, with nonprofits seeing just $0.03 in revenue per dollar spent on out of home fundraising advertising.

Cost per donation has a major impact on ROAS — the more it costs to generate a single gift, the more difficult it is to see a positive return. Search had a high ROAS, and we see a relatively low cost per donation of $55. Out of home has a low ROAS, and we see an actually very high cost per donation of $2,622.

Our data set doesn’t allow us to make ROAS comparisons between nonprofit sectors or sizes for most channels, but we are able to do so for three digital channels: display, search, and Meta. 

Across nonprofits of every size and sector, search advertising had the highest return on ad spend. Hunger/Poverty nonprofits saw the best ROAS of any sector across all three channels. The Hunger/Poverty sector’s $4.52 ROAS for display advertising was by far the highest of any sector, and suggests that nonprofits in this space could increase spending significantly while maintaining positive results.

Cost per donation was highest in all channels for small nonprofits. Larger budgets can create more opportunities for testing and optimization, which may have allowed large nonprofits to bring down the average cost per donation. Rights nonprofits spent more than those in any other sector to generate a gift in display and search, though this did not hold true on Meta.

Choosing how to balance advertising budgets depends on metrics like cost per donation and ROAS, along with a complex, overlapping web of considerations. With a low cost per donation and a high ROAS, nonprofits prioritized search. Out of home advertising was inefficient for direct fundraising, but maintaining a visible presence in specific communities might be important to a nonprofit’s goals. Nonprofits might prioritize reaching specific audiences, or hold back on Twitter/X spending out of concerns about the platform.

Beyond generating an immediate return on spending, nonprofits also used advertising to generate leads, grow email and mobile messaging audiences, and drive web traffic.

The average gift to generate a lead through advertising was $3.33, with a wide range between nonprofits in different sectors. At the low end, Public Media nonprofits spent just $0.49 per advertising lead, while at the high end Hunger/Poverty nonprofits spent $18.18 per lead.

Part of this variance is driven by different levels of investment in advertising platforms. The lowest cost per lead was found with cost-per-acquisition (CPA) buys — these platforms often host advocacy actions that reach a large audience, and allow nonprofits to negotiate a set cost per new subscriber. The average cost per lead for these platforms was $1.31, with large nonprofits spending just $1.08 per lead.

Meta had an average cost per lead of $4.44, with significant variation by sector. TikTok and Google/YouTube efforts had the highest cost per lead.

For some nonprofits, these lead generation efforts were an important part of maintaining a healthy email program. The average ratio of ad-acquired lead to start of year email list size was 0.06. That means that a nonprofit that started 2023 with 100,000 email subscribers would acquire 6,000 new leads via ads over the course of the year.

The median figure for Disaster/International Aid nonprofits was twice as high — a ratio of 0.12, so that nonprofit with 100,000 subscribers on January 1 would add 12,000 new ad-acquired leads. At the 75th percentile, the ratio was 0.47 for Disaster/International Aid nonprofits, the equivalent of adding 47,000 leads to a 100,000 subscriber list over the course of the year. That many new subscribers in a relatively short time can have a dramatic impact on email and mobile messaging performance.

We began this section noting that Google Grants is often the starting place for nonprofits exploring advertising, so let’s end there as well. These placements differ from paid search advertising.

First, they are run with ad credits; we’re presenting Google Grants data in terms of “dollars spent” to put it on similar footing to other channels, but this advertising doesn’t represent actual spending.

Google also imposes caps on total budget and cost per click for Grants ads, limiting the terms nonprofits can cover using Grants. Perhaps the most important difference is that Google Grants search results appear below paid results, which makes users less likely to click.

The upshot of these differences is that Google Grants ads were not nearly as effective as paid search efforts. The ROAS for these Google Grants campaigns was $0.13 overall; the average ROAS for paid search was $2.70. Even though Google Grant placements are free, the net return is still significantly lower than paid search.

The “cost per donation” for Google Grants was also far higher than for paid search. Remember that this “cost” is in ad credits rather than payments made by nonprofits. On average, nonprofits spent the equivalent of $1,192 in Google Grants credits to generate one donation.

While direct fundraising metrics fall short of paid search, Google Grants can make a meaningful impact on digital programs. Nonprofits received 332 site visits for every $1k in Grant spend. Small nonprofits were particularly effective at generating web traffic with Google Grants, with 488 visits per $1,000 spent.

Advertising platforms, audience preferences, and nonprofit strategy are changing quickly. Building a successful program means adapting, adjusting, and stretching to meet those twists and turns.

Social Media and Influencers

Social Media and Influencers

SCORECARD

  • TikTok audiences for nonprofits increased by 112% in 2023, far faster than other social media platforms. Facebook and Instagram follower counts grew by 6% and 11%. The number of Twitter/X followers declined by 1% on average.
  • About half of M+R Benchmarks participants reported working with social media influencers in 2023. Of those, 17% relied only on paid partnerships, and 30% used a mix of paid and unpaid influencer work.
  • Among nonprofits with paid influencer campaigns, 50% used those partnerships for fundraising, 75% for advocacy or volunteer asks, and 79% for education or persuasion.
  • For every 1,000 email addresses, nonprofits had an average of 1,041 Facebook fans, 527 Twitter/X followers, 251 Instagram followers, and 36 TikTok followers.

Chaotic. Competitive. Frantic. Needlessly aggressive much of the time.

That’s social media.

Right this second, millions of users, brands, posters, influencers, and secret bots are competing for space and attention, producing and consuming content at a breakneck pace. They are hungry. Hungry.

In this context, it’s essential to have a clear sense of your priorities. Not only which platforms you’ll participate in, but which metrics matter to your program — total audience size, key demographics, specific audiences like lawmakers or press, overall views, daily engagement, direct response metrics like donations, and on and on.

Most of these goals depend on reaching a lively, engaged audience. We want to find people who are excited to participate, and the quickest way to find them is to look at the places where new users are clamoring to join the conversation.

In 2023, TikTok audiences for nonprofits grew much, much faster than any other major social media platform. The number of followers on TikTok more than doubled in 2023, with 112% growth on average. In the Disaster/International Aid sector, TikTok follower count increased by 267%.

In contrast, the number of followers increased by an average of 6% on Facebook, and 11% on Instagram. And for the first time since we started tracking social media metrics in M+R Benchmarks, the average follower count for a platform actually decreased — nonprofits in our study saw the number of Twitter/X fans decline by 1%.

The rate of change for audience size tells us about where people are going but does not necessarily reflect where people already are. Despite the rapid growth in TikTok followers, overall audience size was still much larger for Meta platforms and Twitter/X.

On average, nonprofits had 1,041 Facebook fans for every 1,000 email subscribers — meaning the two audiences were comparable in size. Twitter/X follower count was roughly half that size, at 527 followers per 1,000 email subscribers. Cut that in half again and you get Instagram followers, at 251 per 1,000 email subscribers. TikTok follower numbers were another order of magnitude smaller, 36 per 1,000 email subscribers.

Which is all to say that nonprofits have a long way to go to build the kind of audiences on TikTok that they have developed on more mature platforms (and there’s no guarantee they will ever reach that level).

Nonprofits must balance audience size, audience growth, audience engagement, and other considerations (e.g. Does the CEO of this company represent an affront to human dignity?) in deciding where and what to post.

In 2023, Facebook and Instagram had nearly universal adoption among M+R Benchmarks participants, and nearly 90% of nonprofits used Twitter/X. Looking at newer platforms, 39% of nonprofits used TikTok, and 32% had joined Threads.

We surveyed M+R Benchmarks participants, and found that 13% of those with active Twitter/X accounts are planning to leave the platform or sunset the account in some way. Regardless of active plans for leaving the platform, 62% of nonprofits active on Twitter/X reported that they have started building a presence on other emerging platforms.

With several social networks vying to be “new Twitter,” nonprofits were most likely to explore Threads. A smaller number of nonprofits explored Mastodon, Discord, and Bluesky.

Throughout all these shifts, nonprofits continued to put out a steady stream of content across social media platforms.

Up until now, we have focused on direct interactions between nonprofits and social media audiences. But when it comes to capturing eyeballs, often the best approach is to have a third party with a large audience do the talking. That’s where influencers come in.

Just about half of the nonprofits in M+R Benchmarks worked with influencers in 2023. Of those, 17% relied solely on paid influencers to promote campaigns or other content, and 52% worked with influencers but did not pay for promotion. In addition, 30% of the nonprofits who worked with influencers used a blended approach, working with both paid and unpaid influencers.

Instagram was the most commonly used platform for influencer campaigns. Of those nonprofits with active efforts, 94% worked with influencers on Instagram. As we’ve seen, the number of TikTok followers for most nonprofits was far smaller than equivalent audiences on other platforms — but 63% of nonprofits with influencer campaigns extended their reach through partnerships on TikTok.

Typically, the cost of working with paid influencers scales alongside follower count; influencers with the widest reach tend to command the highest rates. In 2023, nonprofits spread their influencer work across a broad range.

At the lower end, 77% of nonprofits with active efforts worked with influencers with fewer than 10,000 followers, and 85% worked with influencers with 10k–100k followers. In many cases, these smaller influencers are active in issue areas relevant to a nonprofit’s mission or are able to reach specific audiences.

At the other end of the spectrum, 47% of nonprofits with influencer campaigns worked with influencers that had more than a million followers.

The most common use of paid influencers was to increase visibility for a nonprofit brand, cause, or campaign — 79% of nonprofits with influencer campaigns did narrative change or persuasion work. Promoting volunteer or advocacy actions was close behind at 75%. And among nonprofits with paid influencer partnerships, half relied on influencers to promote fundraising.

The social media space continues to change quickly, with nonprofits and their supporters shifting tactics, following trends, and looking to rise above the chaos. Setting clear priorities is crucial to driving success — as is a willingness to experiment and take risks, whether that means working with influencers or joining an emerging platform.

Website Performance

Website Performance

SCORECARD

  • The majority of nonprofit website traffic came from users on mobile devices (including both phones and tablets). Mobile users represented 52% of all visits, with 48% of traffic from users on desktop devices.
  • Users on desktop devices made up the majority of donation transactions (67%) and revenue (78%).
  • The average gift made on desktop devices was $137; for mobile users, the average gift was $83.
  • PayPal was the most widely-used alternative payment method — 67% of nonprofits made this option available on donation pages. Apple Pay (38%) and Google Pay (30%) were also in use.
  • Google’s shift from Universal Analytics to Google Analytics 4 has made aggregate year-over-year data collection more difficult by… actually, it’s a bit more complicated than what we usually try to fit in these little SCORECARD call-outs, so you should probably just read this whole section.

Consciously or not, we often plan for a best-case scenario. We set a goal or a destination, and we make a plan to reach it assuming that all goes well. Then, the real world intervenes. There are complications, diversions, and opposing forces popping up to knock us off track.

Anticipating those complications is a helpful skill, but even the best-laid plans will run into trouble.

Before we get into website performance data, we want to talk about the problems with tracking website performance — and give you some tools to make tracking your own program easier.

The trouble began, as so many modern problems do, with a tech company making unilateral changes without first checking to see if it would inconvenience us personally. Rude! On July 1, 2023 Google Analytics 4 (GA4) officially replaced Universal Analytics (UA).

The short version is like this. UA implemented a session-based tracking model that used cookies to record all web activity during a user’s session on a site within a given time frame. As enhanced privacy protections make cookies less widely available, GA4 adopted an event-based tracking model. GA4 collects data from users who have consented to Google tracking and then uses machine learning models to estimate site-wide data for unconsenting users. This isn’t to say all change is bad; generally GA4’s event-based tracking offers a more thorough view of each user’s journey including cross-device and cross-platform tracking.

(Sorry, we said that was the short version, not necessarily the simple version. More details can be found here if you are interested in web analytics. Or if you are not particularly interested in web analytics but suffer from insomnia.)

The shift from UA to GA4 has wide-ranging implications for privacy, ecommerce, the global economy, the future of tech, yadda yadda yadda. More to the point, it has a direct impact on Benchmarks, and on your own program. That’s the stuff we care about right now.

With the transition from UA to GA4 occuring mid-year in 2023, year-over-year comparisons of traffic, user behavior, and other key metrics became much messier. Even something as seemingly simple as counting total users would not be an apples-to-apples comparison between the two systems because of the changes made to the underlying logic of many key metrics. In addition, the default settings for GA4 keep only two months of data available to use in GA4’s Explorations (see Principal Data Analyst Lia Mancuso’s advice on changing your settings in the sidebar to this section).

For these reasons, we have decided to use only GA4 data collected from November and December in the website performance charts for this year’s M+R Benchmarks.

The bad news here is that we have a more limited data set, and that we are not able to make year-over-year comparisons for these metrics. The good news is that our limited data set includes the critical end-of-year period when many nonprofits see a spike in traffic and revenue. The even better news is that we should be able to be back to full-year reporting in the next edition of Benchmarks.

Got all that? Good. Now let’s look at some charts, finally! And since we all waited so patiently while we got into methodological constraints, we’ll start with one of our very favorite charts. (We are primarily concerned with the accuracy of our charts rather than the aesthetics, but this one is a favorite because it always looks so nice and paints such a clear picture of what’s happening out in the real world.)

In the final months of 2023, desktop users accounted for 48% of nonprofit web traffic, with mobile users (including both phones and tablets) comprising the other 52%. While desktop visitors were a minority of all traffic, they generated 67% of all donation transactions, and 78% of all online revenue.

We want to emphasize once again that this includes only data from the final two months of the year, and that we can’t draw direct year-over-year comparisons, and that you are not allowed to go look at last year’s M+R Benchmarks to compare results there because our participant pool has changed. However. If you were to look at the equivalent chart from past years, you would see a very consistent pattern: desktop users accounting for roughly half of traffic, two thirds of transactions, and three quarters of revenue.

While the overall picture looks familiar, there were some striking differences within sectors. For Environmental nonprofits, desktop users represented the majority of traffic, and accounted for 83% of revenue. For the Wildlife/Animal Welfare sector, 70% of website visits came from mobile users, along with 57% of transactions and 42% of revenue.

Of those desktop users who made their way to a nonprofit’s main donation page, 16% completed a gift. For mobile users, the main donation conversion rate was just 10%. Public Media was the only sector to see a higher conversion rate for mobile users than for desktop users.

Average gift was also higher for desktop visitors than for mobile visitors — $137 compared to $83.

These differences may be driven by a combination of audience demographics and preferences, traffic sources, and nonprofit tactics including website optimization and direct response efforts.

One way that many nonprofits have attempted to increase conversions among mobile users is by adopting alternative payment platforms. The most popular of these is PayPal, which was an option on donation pages for 67% of M+R Benchmarks participants. Apple Pay and Google Pay were accepted by 38% and 30% participants, respectively. And 53% of nonprofits allowed donors to give directly from a Bank Account/EFT.

Overall, 44% of visits to the nonprofits in our study came from organic traffic. This category includes visitors who searched for a term and clicked on an unpaid result. It excludes other sources like direct links on other sites, social media, email, paid advertising, or users simply entering a URL.

Combining users from devices of all types, the average main donation page conversion rate was 12%. (Each participant identified their own “main donation page” — typically it’s the one you land on if you click the big DONATE button that is probably in the top right corner of your homepage.) While this metric varied between sectors, we did not find significant differences between nonprofits of different sizes.

We can hope for a best-case scenario, where potential supporters can easily search for a cause that matters to them and find their way directly to the content they are looking for — whether that’s information, an opportunity to take meaningful action, a convenient way to donate, or something else. And it happens all the time, it really does! But not every path forward is smooth or uninterrupted, and the decisions being made by Google, Apple, Meta, and other corporations can create trouble in unexpected ways.

We look forward to being able to report even more comprehensive data on web performance next year. In the meantime, there are some important settings in GA4 that determine how complete your own data is. If you have not already done so, making these changes will help ensure that you can collect and retain the data you need to measure your website performance.

Glossary

Advocacy Message
An email or SMS message that asks recipients to sign an online petition, send an email to a decision-maker, or take a similar online action. For the purposes of this Study, advocacy response rates do not factor in higher-bar actions like making a phone call or attending an event, largely because tracking offline response is inconsistent across organizations. Advocacy email rates were calculated from advocacy emails with a simple action sent to either the full file or a random sample of the full file.
Cavity Sam
This is the actual name of the person you perform surgery on in the game Operation. It’s a pretty gross name.
Click-Through Rate
Calculated as the number of people who clicked on any trackable link in an email or text message divided by the number of delivered emails or text messages. People who clicked multiple times in one email were only counted once. In other words, if a subscriber clicked on every link in a message 10 times, this was counted the same as if the subscriber had clicked once on a single link.
Connected TV Advertising
Digital television delivered to a smart television or "over-the-top" device like Roku or Fire stick. Does not include streaming on a PC or mobile phone.
Deliverable Emails
Only the emails that were delivered, not including the emails that are considered inactive or emails that were sent and bounced. “Delivered” email messages may land in a user’s inbox, spam folder, promotions tab, or custom folder.
Device Type, Desktop
We use the definitions provided by Google Analytics to separate traffic data by device type. The “desktop” category includes any desktop or laptop computer with a screen larger than 7” in diagonal.
Device Type, Mobile
We use the definitions provided by Google Analytics to separate traffic data by device type. Mobile devices are hand-held devices that include a phone or a tablet.
Digital Audio Advertising
Streaming music or podcast service, delivered via a website or app. Not traditional or satellite radio.
Digital Organizing
Recruiting, engaging and organizing members, activists, and/or volunteers toward advocacy outcomes.
Fans, Facebook
People who “like” a nonprofit’s Facebook Fan page.
Followers, Instagram
People who subscribe to see posts from a nonprofit’s Instagram account.
Followers, TikTok
People who follow a nonprofit’s TikTok account.
Followers, Twitter/X
People who subscribe to receive the tweets from a nonprofit’s Twitter account.
Full File
All of an organization’s deliverable email addresses, not including unsubscribed email addresses or email addresses to which an organization no longer sends email messages.
Fundraising Message
An email or SMS message that only asks for a donation, as opposed to an email newsletter, which might ask for a donation and include other links. For the purposes of this Study, fundraising email only includes one-time donation asks; it does not include monthly gift asks. Fundraising email rates were calculated from all fundraising emails, regardless of whether the email went to the full file, a random sample of the file, or a targeted portion of the file.
Google Grants
A distinct Google Ads account where nonprofits can buy up to $10,000/mo in search ads using free credits. Subject to restrictions (such as caps on certain bidding strategies): think of it as a giant coupon with a lot of fine print!
Influencers
Social media influencers are people who have an established presence on one or more social media platforms, with a reputation for being knowledgeable about a certain topic. Influencers regularly post content around that topic for their established, engaged follower base. These audiences, ranging from thousands to millions, follow influencers for their authentic views on their area of expertise.
Linear Television Advertising
Traditional television, with content delivered via satellite or cable. Not connected tv.
List Churn
Calculated as the number of subscribers who became unreachable in a 12-month period divided by the sum of the number of deliverable email addresses at the end of that period plus the number of subscribers who became unreachable during that period. Study participants were required to track the number of subscribers who became unreachable each month to account for subscribers both joining and leaving an email list during the 12-month period who would otherwise go uncounted.
Monthly Gift
A donation where the donor signs up once to donate on a regular schedule, typically by pledging a regular gift amount on a credit card each month. Also known as a sustaining gift.
Muzjiks
A Russian peasant, especially prior to 1917. “MUZJIKS” generated the highest-ever score for an opening word in competitive Scrabble, earning Jesse Inman 126 points in the 2008 National Scrabble Championship.
Newsletters, Email
An email with multiple links or asks, which can include fundraising or advocacy asks. Email newsletter rates were calculated from all email newsletters, regardless of whether the newsletter went to the full file, a random sample of the file, or a targeted portion of the file.
Online Retention, New Donor
Of the donors that made their first-ever online gift in the previous calendar year, the percent that made an online gift in the current calendar year. Note that we count someone as “new” in 2023 if they have no online donations reported between the start of 2019 and the end of 2022.
Online Retention, Prior Donor
Of the donors that made an online gift in the previous calendar year that wasn’t their first online gift, the percent that made an online gift in the current calendar year.
Out of Home Advertising
Ads appearing outdoors, like on billboards, street furniture, transit infrastructure. Can be traditional printed media or digital screens.
Page Completion Rate
Calculated as the number of people who completed a form divided by the number of people who clicked on the link to get to that form. For the purposes of this Study, it was not always possible to use the number of people who clicked on a link to a specific form, so we used the number of unique clicks in the message.
Peer-to-Peer Text Messaging
Unlike a single mass message to a full list, these SMS messages connect volunteers and staff to individuals, enabling one-on-one conversations.
Percentile
The percentage of observed values below the named data point. 25% of the observations are below the 25th percentile; 75% of the observations are below the 75th percentile. The values between the 25th percentile and the 75th percentile are the middle 50% of the observed values and represent the normal range of values.
Ratio of Ad-Acquired Leads to Start of Year Email List Size
Ratio of new email leads acquired through digital advertising divided email size at the start of the year.
Relational Organizing
Mobilizing personal contacts within a volunteer’s network. It could be calls, texts, or in-person conversations with people in their own community.
Response Rate
Calculated as the number of people who took the main action requested by an email or text message divided by the number of delivered messages.
Study
A published report containing careful analysis or examination of a subject (e.g. the M+R Benchmarks Study). A room devoted to reading, schoolwork, or literary pursuits. Occasionally, a crime scene.
Unique Clicks
The number of people who clicked on any trackable link in an email message, as opposed to the number of times the links in an email were clicked. If a subscriber clicked on every link in a message 10 times, this is counted as 1 unique click. It is also counted as 1 strange person.
Unsubscribe Rate
Calculated as the number of individuals who unsubscribed in response to an email message divided by the number of delivered emails.
View-Through Revenue
Revenue from donors who made a donation (typically within 30 days) of seeing, but not clicking on, an ad. For example, a supporter who sees a banner ad and later goes directly to the nonprofit’s website to make a gift.
Website Revenue Per Visitor
Calculated as the total revenue from one-time online gifts, plus the value of initial monthly gifts, divided by the total number of website visitors for the year. Depending on retention, the long-term value of monthly gifts may be substantially higher.
Website Donation Page Conversion Rate
Calculated from the number of donations to a participant’s main donation page, divided by the number of unique pageviews of that page. We included only unique pageviews for the one-time donation page, if a separate donation page existed for monthly gifts.
Website Page Load Time
The number of seconds before a page appears to be visually complete, as measured by the WebPageTest tool at http://webpagetest.org.
Website Visitors Per Month
The number of monthly unique visitors to a participant’s main website.

Participant List

Cultural

American Museum of Natural History
Arts Alliance Illinois
Barnes Foundation
California Academy of Sciences
Central Park Conservancy
Hillel International
Monterey Bay Aquarium
Museum of Science
National Trust for Historic Preservation

    Disaster/International Aid

    Action Against Hunger USA
    ActionAid UK
    American Jewish World Service
    American Red Cross
    Anera
    Bread for the World
    British Red Cross
    Canadian Red Cross
    Christian Aid
    Concern Worldwide
    FINCA International
    HIAS
    International Development Research Centre (IDRC)
    International Medical Corps
    International Rescue Committee UK
    International Rescue Committee US
    Irish Red Cross
    Islamic Relief UK
    MAG (Mines Advisory Group)
    Oxfam America
    Oxfam GB
    Philip Hayden Foundation
    Right To Play
    Root Capital
    Save the Children USA
    Sightsavers
    Trócaire
    UK for UNHCR
    UNICEF UK
    USA for UNHCR
    WaterAid UK
    Women for Women International UK
    World Food Program USA

    Environmental

    Alliance for the Great Lakes
    Appalachian Mountain Club
    Conservation Law Foundation
    Conservation Minnesota
    Earthjustice
    Ecojustice
    Environmental Defense Fund
    Evergreen Action
    Food & Water Watch
    Friends of the Earth
    Greenpeace Canada
    Greenpeace UK
    Greenpeace USA
    League of Conservation Voters
    Mono Lake Committee
    Mystic River Watershed Association
    National Audubon Society
    National Parks Conservation Association
    Natural Resources Defense Council
    Nature Conservancy of Canada
    North Carolina League of Conservation Voters
    NRDC Action Fund
    Oceana
    Overton Park Conservancy
    Rails-to-Trails Conservancy
    Rare
    Riverkeeper
    Save the Boundary Waters
    Sierra Club
    Southern Utah Wilderness Alliance (SUWA)
    The Trust for Public Land
    The Wilderness Society
    The Wilderness Society Action Fund
    Union of Concerned Scientists
    Washington Trails Association
    Waterkeeper Alliance
    World Wildlife Fund
    Wyoming Outdoor Council

    Health

    Action on Smoking and Health
    Alzheimer Society of Canada
    Alzheimer Society Waterloo Wellington
    Alzheimer's Association
    American Cancer Society
    American Heart Association
    American Kidney Fund
    American Lung Association
    Atlanta Ronald McDonald House Charities
    Blood:Water
    Chef Ann Foundation
    Children's Hospice South West
    Children's Hospital Los Angeles
    Colorectal Cancer Alliance
    CureSearch for Children’s Cancer
    Cystic Fibrosis Foundation
    Dementia UK
    Evelina London Children's Charity
    Great Ormond Street Hospital Children's Charity
    Guy's & St Thomas' Charity
    Guy's Cancer Charity
    Health Equity International
    Holland Bloorview Kids Rehabilitation Hospital Foundation
    Hospice UK
    LauraLynn, Ireland's Children's Hospice
    Leukemia and Lymphoma Society of Canada
    March of Dimes
    Marie Curie
    MIND
    Muscular Dystrophy Association
    National Deaf Children's Society
    National Kidney Foundation
    Pieta
    ReSurge International
    Ronald McDonald House Charities of Chicagoland & Northwest Indiana
    Samaritans
    San Francisco AIDS Foundation
    Smile Train US
    Special Olympics
    Terrence Higgins Trust
    Young Lives vs Cancer
    ZERO Prostate Cancer

    Hunger/Poverty

    Akron-Canton Regional Foodbank
    Atlanta Community Food Bank
    Banco de Alimentos de Puerto Rico Inc.
    Blue Ridge Area Food Bank
    Child Poverty Action Group
    Community Food Bank of New Jersey
    Feeding America
    FIND Food Bank
    Food Bank for the Heartland
    Food Bank of Northeast Louisiana
    Food Bank of Northwest Indiana
    Food Bank of the Rockies
    Foodbank of Southeastern Virginia and the Eastern Shore
    Freestore Foodbank
    God's Pantry Food Bank, Inc.
    Golden State Opportunity Foundation
    Good Shepherd Food Bank
    Great Plains Food Bank
    Greater Chicago Food Depository
    Greater Cleveland Food Bank
    Greater Pittsburgh Community Food Bank
    Maryland Food Bank
    Oregon Food Bank
    Railway Children
    Rhode Island Community Food Bank
    San Francisco-Marin Food Bank
    Second Harvest Food Bank of Greater New Orleans and Acadiana
    Second Harvest Food Bank of Middle Tennessee
    Second Harvest Foodbank of Southern Wisconsin
    Second Harvest Heartland
    Terre Haute Catholic Charities Foodbank
    The Food Bank of Contra Costa and Solano
    The Salvation Army
    Union Gospel Mission (Vancouver)

    Public Media

    KAWC
    KNKX
    Louisville Public Media
    Maine Public
    Nebraska Public Media
    WAMU 88.5
    WETA
    WHYY

    Rights 

    ACLU
    Amnesty International UK
    Amnesty International USA
    Center for Reproductive Rights
    ClientEarth
    Equality Federation
    Fòs Feminista
    GLBTQ Legal Advocates & Defenders (GLAD)
    Global Fund for Women
    Human Rights Campaign
    Kids in Need of Defense (KIND)
    National Women's Law Center
    Planned Parenthood Action Fund
    Planned Parenthood Federation of America
    RAICES
    Refuge
    Reprieve
    Southern Poverty Law Center

    Wildlife/Animal Welfare

    BC SPCA
    Best Friends Animal Society
    Canadian Wildlife Federation
    Center for Biological Diversity
    Dogs Trust
    Dogs Trust Ireland
    Humane Society International
    Humane Society International/Europe
    IFAW UK
    International Fund for Animal Welfare
    Joybound People & Pets
    National Wildlife Federation
    Operation Kindness
    People for the Ethical Treatment of Animals
    RedRover
    Rise for Animals
    The Brooke
    The Humane Society of the United States
    The International Wildlife Rehabilitation Council
    Woodgreen Pets Charity
    World Animal Protection Canada

    Other

    Afterschool for Children and Teens Now (ACT Now) Coalition
    American Friends Service Committee
    Barnardos Ireland
    Boys & Girls Clubs of America
    Dave Thomas Foundation for Adoption
    Friends Committee on National Legislation
    Indspire
    Kenneth Rainin Foundation
    Make-A-Wish UK
    MoveOn
    National Education Association
    National Network to End Domestic Violence (NNEDV)
    Non-Profit Housing Association of Northern California
    Project On Government Oversight
    RNLI
    Room to Read
    SEIU
    True Patriot Love Foundation
    UJA Federation of New York
    USOPC

    Archive

    Benchmark Yourself

    Select A Section:

    Enter your Data:

    Scorecard
    You Benchmark
    {{ deltaRevenue() }} Change in online revenue {{ sectorChangeInOnlineRevenue() }}
    {{ advocacyClickthroughRate() }} Click-through rate {{ sectorAdvoClickThrough() }}
    {{ advocacyResponseRate() }} Response rate {{ sectorResponseRate() }}
    {{ fundraisingClickthroughRate() }} Click-through rate {{ sectorFundClickThroughRate() }}
    {{ fundraisingResponseRate() }} Response rate {{ sectorResponseTime() }}
    {{ amountRaisedPer1000Emails() }} The amount raised for every 1,000 fundraising emails delivered {{ sectorRaisedPer1000Emails() }}

    Download the 2024 Infographic

    By signing up, you agree to receive emails from M+R. You may unsubscribe at any time.

    Click here to download the Infographic.

    Sign up for Next Year

    By signing up, you agree to receive emails from M+R. You may unsubscribe at any time.

    Thanks for signing up! We'll be in touch.

    Download the 2024 Benchmarks Report

    By signing up, you agree to receive emails from M+R. You may unsubscribe at any time.

    Click here to download the Report.